Visual dataset and results representation
Datasets
A truth discovery dataset can be represented visually as directed graph, where the nodes are the sources, claims and objects, and there is an edge from each source to each claim it makes, and an edge between each claim and the variable it relates to.
Such graphs can be created as a PNG image with the GraphRenderer
class.
from truthdiscovery import Dataset, GraphRenderer
tuples = [
    ("source 1", "x", 4),
    ("source 1", "y", 7),
    ("source 2", "y", 7),
    ("source 2", "z", 5),
    ("source 3", "x", 3),
    ("source 3", "z", 5),
    ("source 4", "x", 3),
    ("source 4", "y", 6),
    ("source 4", "z", 8)
]
mydata = Dataset(tuples)
renderer = GraphRenderer()
with open("/tmp/my-dataset-as-a-graph.png", "wb") as imgfile:
    renderer.render(mydata, imgfile)

Note that the output file must be opened in binary mode. See the
GraphRenderer documentation for the available options (such as image
size, node size, line widths etc…).
Results
The results of a truth discovery algorithm can be visualised in the graph
representation by colouring the sources/claims according to their trust and
belief scores. This is done with the ResultsGradientColourScheme colour
scheme:
from truthdiscovery import Sums, GraphRenderer, ResultsGradientColourScheme
# create `mydata` as above...
results = Sums().run(mydata)
colour_scheme = ResultsGradientColourScheme(results)
renderer = GraphRenderer(colours=colour_scheme)
with open("/tmp/my-dataset-with-results.png", "wb") as imgfile:
    renderer.render(mydata, imgfile)
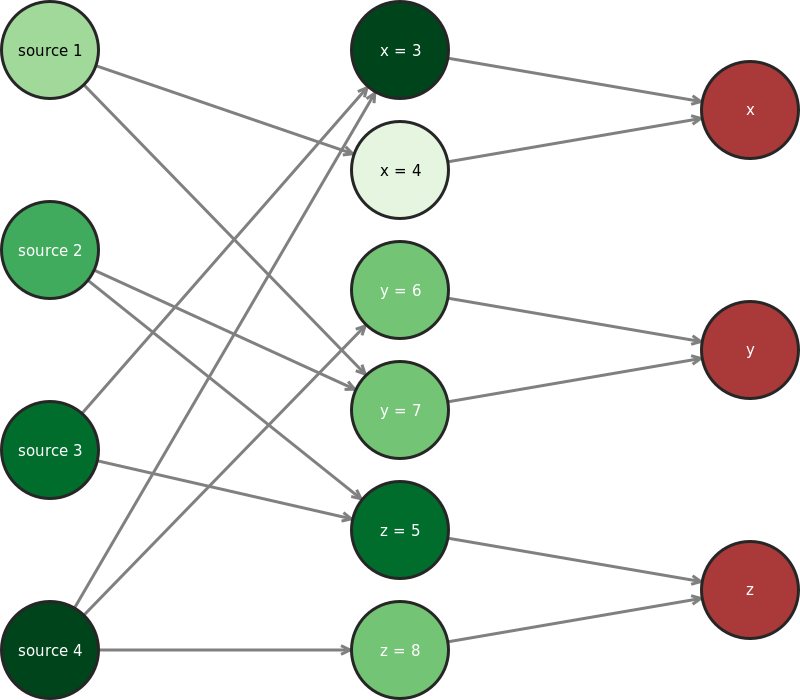
Lighter and darker colours represent low and high trust/belief scores Respectively. Note that there are 9 fixed colours in this scale – it is not a continuous gradient. This means that nodes with the same colour do not necessarily have identical trust/belief scores.
Animations
For iterative algorithms, one may wish to visualise not just the final results,
but the partial results at each iteration as the algorithm progresses. The
GifAnimator class implements creating animated GIF files for this
purpose:
from truthdiscovery import (
    ConvergenceIterator, Dataset, DistanceMeasures, GifAnimator, Investment
)

tuples = [
    ("source 1", "x", 4), ("source 1", "y", 7), ("source 2", "y", 7),
    ("source 2", "z", 5), ("source 3", "x", 3), ("source 3", "z", 5),
    ("source 4", "x", 3), ("source 4", "y", 6), ("source 4", "z", 8)
]
mydata = Dataset(tuples)

alg = Investment(iterator=ConvergenceIterator(DistanceMeasures.L2, 0.01))
animator = GifAnimator(frame_duration=0.2)  # 0.2 seconds per iteration

with open("/tmp/animation.gif", "wb") as imgfile:
    animator.animate(imgfile, alg, mydata)
